


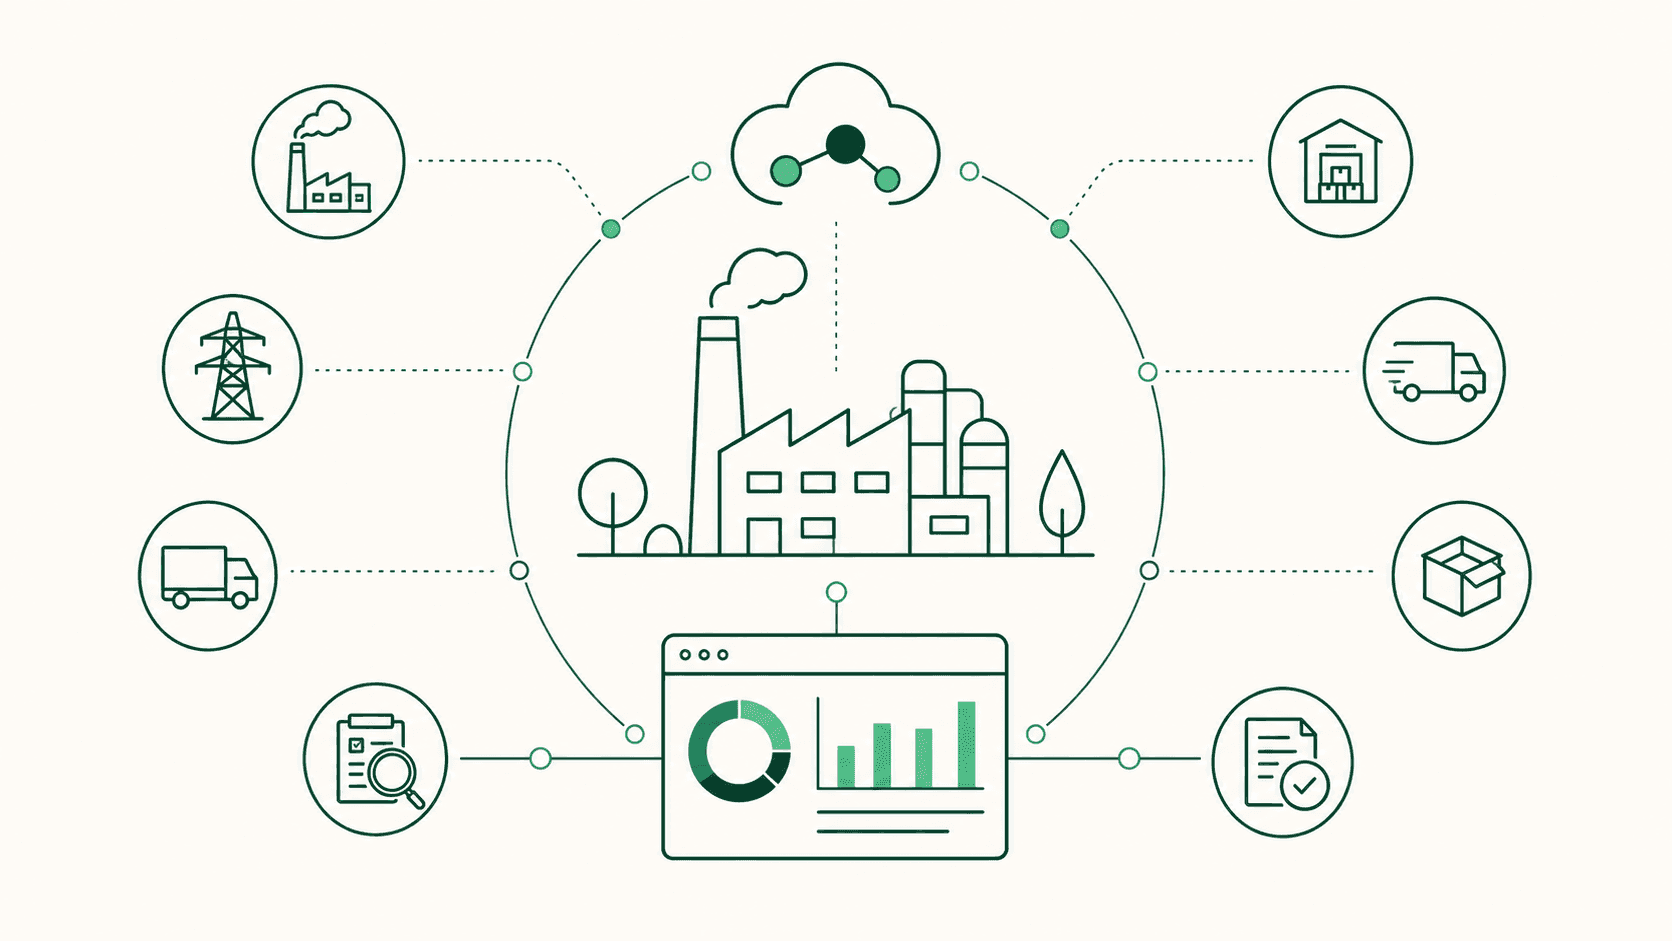
A carbon footprint measures the greenhouse gas emissions associated with a company’s activities. The result is expressed in tonnes of carbon dioxide equivalent, or CO₂e, a unit that makes it possible to aggregate gases with different global warming potentials.
For a company, calculating its carbon footprint means building an inventory of the emissions generated directly by facilities and company vehicles, purchased energy and activities across the value chain. The calculation requires clear boundaries, verifiable data, up-to-date emission factors and a consistent methodology over time.
A reliable GHG inventory helps companies identify their most significant emission sources, define reduction measures and monitor the results. The same data can support sustainability reporting, address requests from customers and parent companies, and prepare the inventory for independent verification.
What is a corporate carbon footprint?
A corporate carbon footprint, also known as an organisational carbon footprint, represents the total greenhouse gas emissions associated with a company’s activities over a defined period, usually one year.
The calculation includes gases other than CO₂, such as methane, nitrous oxide and fluorinated gases. To make them comparable, the quantities emitted are converted into CO₂ equivalent based on their global warming potential. The final result can be analysed by company, facility, emission source, category or business unit.
An organisational carbon footprint considers the company as a whole. A Product Carbon Footprint, on the other hand, measures the emissions associated with a product or service within a defined life-cycle boundary. The first supports corporate emissions management; the second assesses the climate impact of a specific product and helps compare alternative materials, processes or configurations.
When the analysis covers several environmental impact categories beyond climate change, Life Cycle Assessment is a more appropriate method. Metrikflow’s guide to what Life Cycle Assessment is explores its methodology, its differences from carbon accounting and its possible corporate applications.
Defining the subject of the analysis before collecting data prevents overlap between organisational and product boundaries. The two assessments may use some of the same data, but they answer different operational questions and produce results based on different units of analysis.
What do Scope 1, Scope 2 and Scope 3 include?
The GHG Protocol Corporate Standard classifies corporate emissions into Scope 1, Scope 2 and Scope 3. This classification describes the relationship between the company and each emission source and helps create an organised inventory while avoiding omissions and double counting.
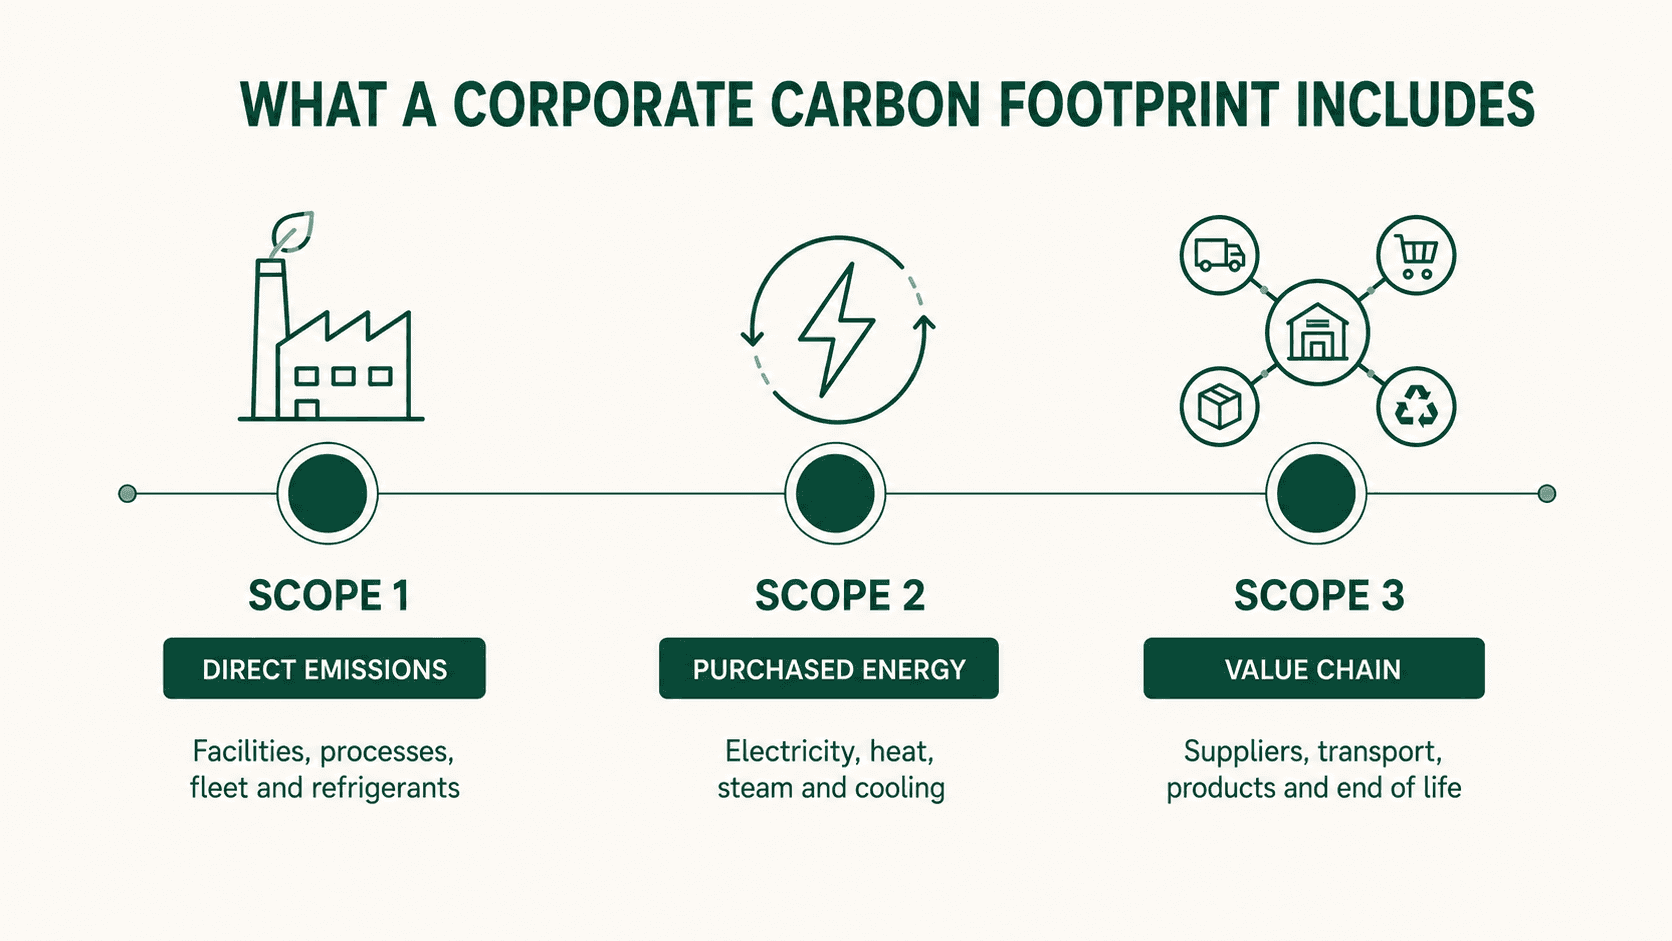
Scope 1 includes direct emissions from sources owned or controlled by the company. Examples include natural gas combustion in facilities, fuel used by company vehicles, emissions from certain industrial processes and refrigerant leaks. The relevant data are often available internally through invoices, consumption records, technical documents and maintenance systems.
Scope 2 covers indirect emissions associated with purchased and consumed energy, including electricity, heat, steam and cooling. For electricity, the GHG Protocol provides two calculation methods. The location-based method uses the average emission factor of the electricity grid, while the market-based method considers specific supply contracts and instruments that verify the origin of the energy. The GHG Protocol Scope 2 Guidance defines the criteria and disclosure requirements for both methods.
Scope 3 covers other indirect emissions generated across the upstream and downstream value chain. These can include purchased goods and services, transport, business travel, employee commuting, waste, capital goods, the use of sold products and end-of-life treatment. The Corporate Value Chain Standard divides these sources into 15 categories, providing a more precise structure for the inventory.
The complexity of Scope 3 depends on the availability of data from suppliers, logistics providers and other external organisations. During an initial assessment, companies may use estimates based on expenditure, purchased quantities or industry averages. In later inventories, the most significant categories can be improved by introducing primary data and more granular collection criteria.
For a more detailed explanation of the classification, see Metrikflow’s guide to Scope 1, Scope 2 and Scope 3 emissions. The dedicated article on Scope 3 emissions explores value-chain sources and the methods available to calculate them.
How to calculate a corporate carbon footprint
A carbon footprint calculation starts by defining its objective. An inventory prepared for internal management may require a different level of detail from one intended for independent verification, a customer request or a sustainability report. The objective determines the boundaries, the required data quality and the evidence that must be retained.
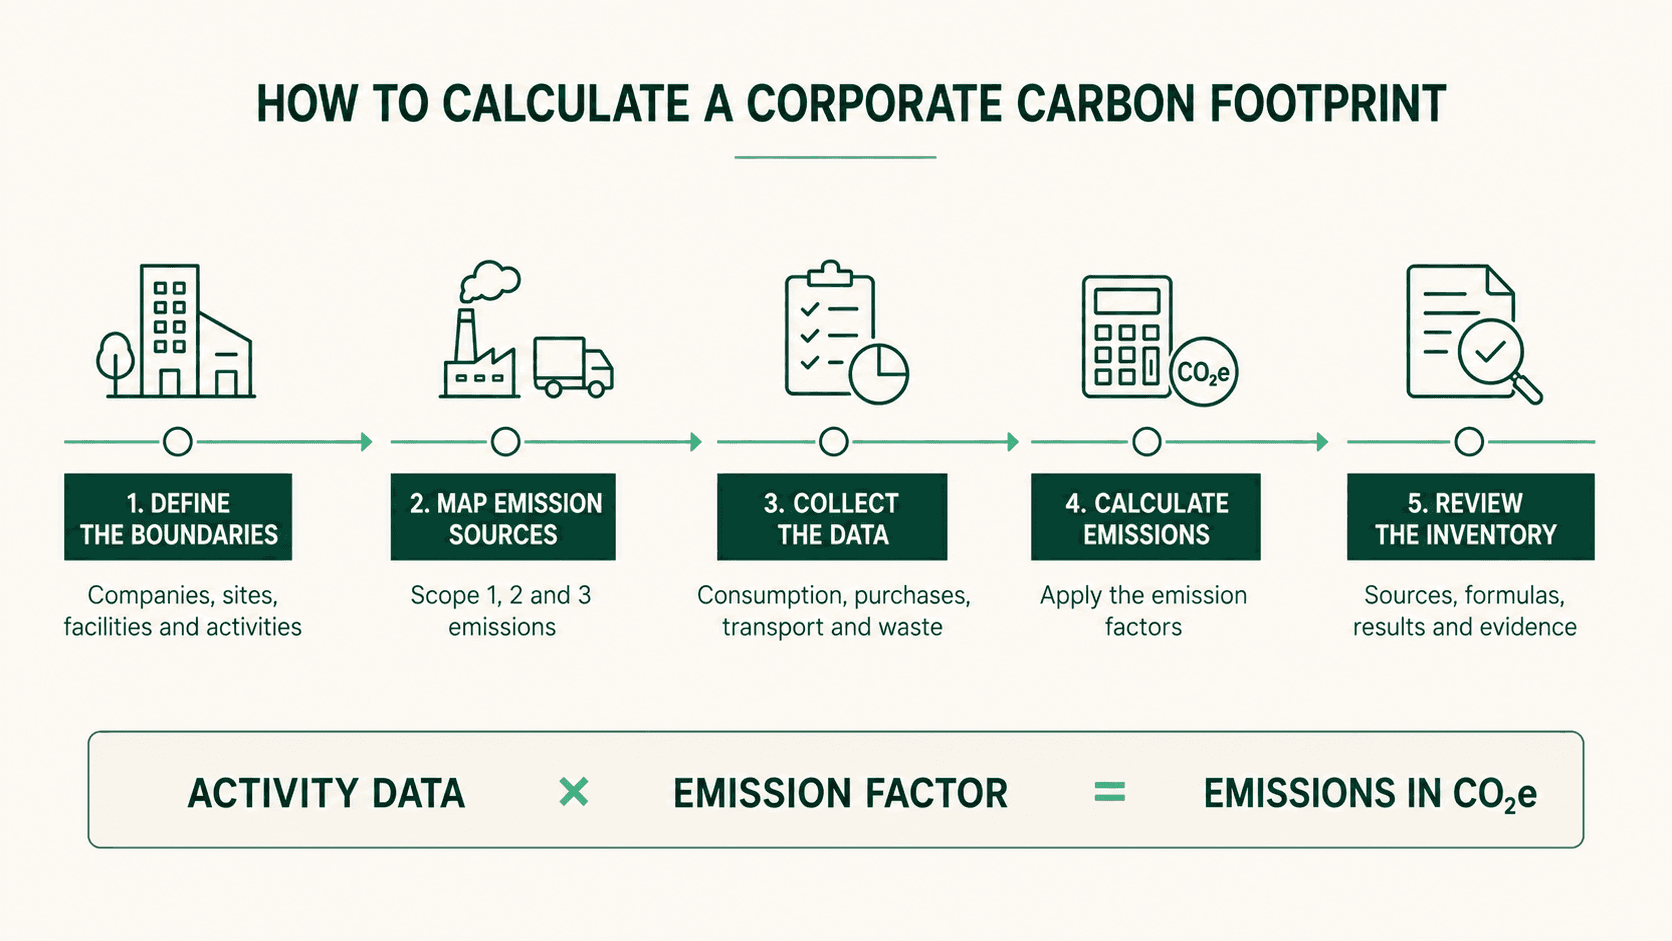
The process can be organised into five phases.
Define the organisational and operational boundaries. The company determines which legal entities, facilities, plants and activities to include. It must also select a consistent consolidation approach, based on operational control, financial control or equity share. This decision must be documented because it affects every subsequent result.
Map the emission sources. For each facility and activity, the company identifies the sources associated with Scope 1, Scope 2 and Scope 3. A complete map connects each source with the department responsible for the data, the update frequency and the documents that can verify its origin.
Collect activity data. Relevant information may include cubic metres of gas, litres of fuel, kilowatt-hours of electricity, kilometres travelled, kilograms of purchased material or tonnes of waste treated. When primary data are unavailable, the estimation method and level of uncertainty should be recorded. A documented estimate is easier to manage than an apparently precise figure with no identifiable source.
Apply the emission factors. The calculation links activity data to a factor from a recognised source that is appropriate for the geography, technology and reporting year. The basic formula is: activity data × emission factor = GHG emissions. The result is then converted into CO₂e. To ensure comparability between reporting periods, companies should record the source, version and date of every factor used.
Build and review the GHG inventory. Results are aggregated by Scope, category, facility or company. Before publication, the company should check units of measurement, conversions, duplicate entries, anomalies and boundary completeness. The inventory should preserve the connection between each result and its original data source.
These phases also explain why a basic carbon footprint calculator can provide only an initial estimate. Entering energy consumption and travel distances into an automated tool may produce an indicative figure, but a corporate inventory requires documented decisions about boundaries, responsibilities, sources and data quality.
Common carbon footprint calculation errors include unclear organisational boundaries, data without supporting evidence, outdated emission factors and undocumented methodological changes. Comparisons between reporting periods may also be misleading if the company has acquired new facilities, divested activities or changed its calculation method. In these cases, the base year may need to be recalculated according to predetermined rules.
GHG Protocol and ISO 14064-1: the main reference standards
The GHG Protocol is one of the most widely used references for classifying and accounting for Scope 1, Scope 2 and Scope 3 emissions. ISO 14064-1:2018 sets out principles and requirements for quantifying and reporting greenhouse gas emissions and removals at the organisational level. The 2018 edition was confirmed in 2024 and is currently under revision.
The two references can be used together. The GHG Protocol provides an internationally recognised classification, while ISO 14064-1 structures the design, management, reporting and potential verification of the inventory. For product carbon footprints, the specific reference is ISO 14067, together with the principles of Life Cycle Assessment.
The methodology should be defined before the calculation begins and maintained across subsequent reporting periods. This allows the company to explain how each result was obtained, which sources were included and which limitations remain.
The term “carbon footprint certification” is often used in general business language. Technically, it is more accurate to refer to the verification of the GHG statement by an independent body. Preparing for verification requires accessible evidence, traceable calculations and a clear record of changes. ISO compliance software can help organise documents, responsibilities and activities related to the process.
From calculation to corporate emission reduction
A total emissions figure provides an initial measurement of the company’s carbon footprint, but business decisions require a more detailed analysis. Breaking down results by source, facility, process and Scope 3 category helps identify emission hotspots and shows where an operational change could have a material effect.
A manufacturing company may find that fuels used in its facilities account for a significant share of emissions. A distributor may identify logistics and refrigeration as its main sources. For a company selling energy-intensive products, the use phase may represent the largest part of Scope 3. Priorities depend on the operating model and must be derived from the inventory data.
Hotspot analysis supports the evaluation of practical measures, such as fuel switching, energy-efficiency improvements, renewable electricity procurement, route optimisation or engagement with high-impact suppliers. Each measure should have an owner, a deadline, an expected investment and an indicator expressed in tCO₂e reduced.
Updating the carbon footprint annually allows the company to compare results with its base year. This comparison should distinguish reductions generated by company actions from changes caused by revenue, production volumes, acquisitions or revised emission factors. Alongside absolute emissions, companies may calculate intensity indicators such as tCO₂e per tonne produced or per million euros of revenue.
Excel or software for corporate carbon footprint calculation?
Excel is often used to start calculating a corporate carbon footprint. It is accessible, familiar to different departments and sufficient for simple inventories involving a small number of facilities and emission sources. It can therefore be appropriate for an initial mapping exercise or a project with a limited boundary.
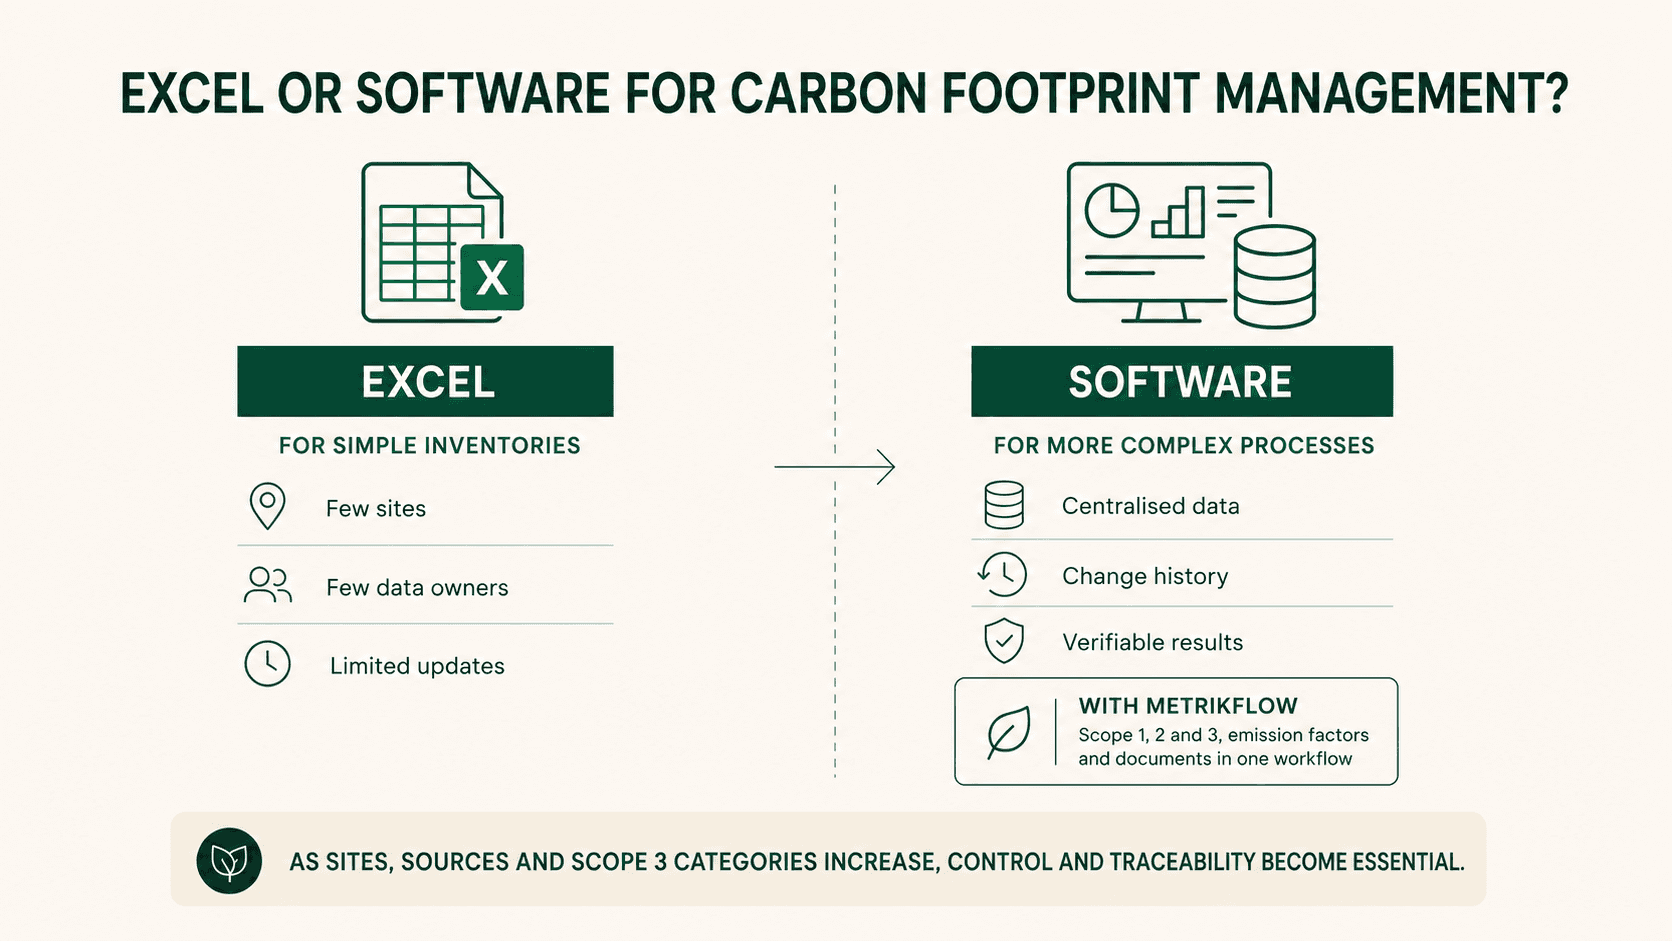
Limitations emerge when the calculation involves several companies, facilities, data owners and Scope 3 categories. Data are collected through separate files, exchanged by email and updated by multiple people. Identifying the correct version, checking who changed a value and tracing the path from the original document to the CO₂e result becomes difficult.
Managing emission factors also requires careful control. Each factor should include its source, version, year, geography and unit of measurement. An update applied to only some files can produce inconsistent results across facilities or reporting periods. Manual formulas also increase the risk of incorrect references, overwritten cells and inconsistent conversions.
Another limitation concerns auditability. During a verification, the company must demonstrate which data were used, how estimates were handled and which factors generated each result. Excel can store this information, but it requires strict rules for file names, permissions, controls and evidence archiving. As the inventory grows, a significant share of the work can be absorbed by file management rather than emissions analysis.
Carbon footprint software centralises data, documents and methodological rules in one environment. It can apply updated emission factors, separate Scope 1, Scope 2 and Scope 3 emissions in line with the GHG Protocol, and retain a history of changes. Role-based access allows each data owner to enter or approve the information for which they are responsible, while project coordinators can monitor progress, completeness and anomalies.
The choice between Excel and carbon accounting software depends on the complexity of the inventory. A company should consider the number of facilities and emission sources, update frequency, supplier involvement and the need for independent verification. If every reporting cycle requires teams to reconstruct files, formulas and evidence, a dedicated system can reduce manual work and improve data continuity between reporting periods.
Metrikflow’s carbon footprint software helps companies collect corporate data, calculate Scope 1, Scope 2 and Scope 3 emissions in line with the GHG Protocol and ISO 14064-1, and maintain a traceable record. The result is a calculation process that is easier to control, update and prepare for verification.
CONTRIBUTOR
Luis Antezana
Sustainability Analyst
Formed as a Chemical Engineer and with a focus on the energy sector, Luis applies a rigorous technical and analytical approach to decarbonisation and emissions measurement. Born in Bolivia and professionally developed across the United States and Europe, he contributes to the design and implementation of Carbon Footprint and Life Cycle Assessment (LCA) methodologies, helping organisations accurately quantify emissions while identifying opportunities to optimise processes, improve resource efficiency, and reduce operational costs. Luis approaches sustainability not only as a compliance exercise, but as a driver of measurable business value—linking environmental performance with economic returns, risk reduction, and long-term competitiveness.He works to make sustainability practical, data-driven, and financially meaningful for organisations and their stakeholders. Topics covered: Decarbonisation, Corporate Carbon Footprint, Life Cycle Assessment (LCA), Scope 1–2–3 accounting, GHG Protocol, Product Carbon Footprint (PCF).
Stay up to date with Metrikflow Insights!
We deliver expert insights, product updates, industry trends, and actionable strategies straight to your inbox. Stay ahead in ESG, GHG, and LCA — one edition at a time.
By submitting this form, you consent to receive the requested resource. For more information on how we process and protect your data, view our Privacy Policy.


