


Scope 1, Scope 2 and Scope 3 are the three categories used by the GHG Protocol to classify the greenhouse gas emissions associated with a company’s activities.
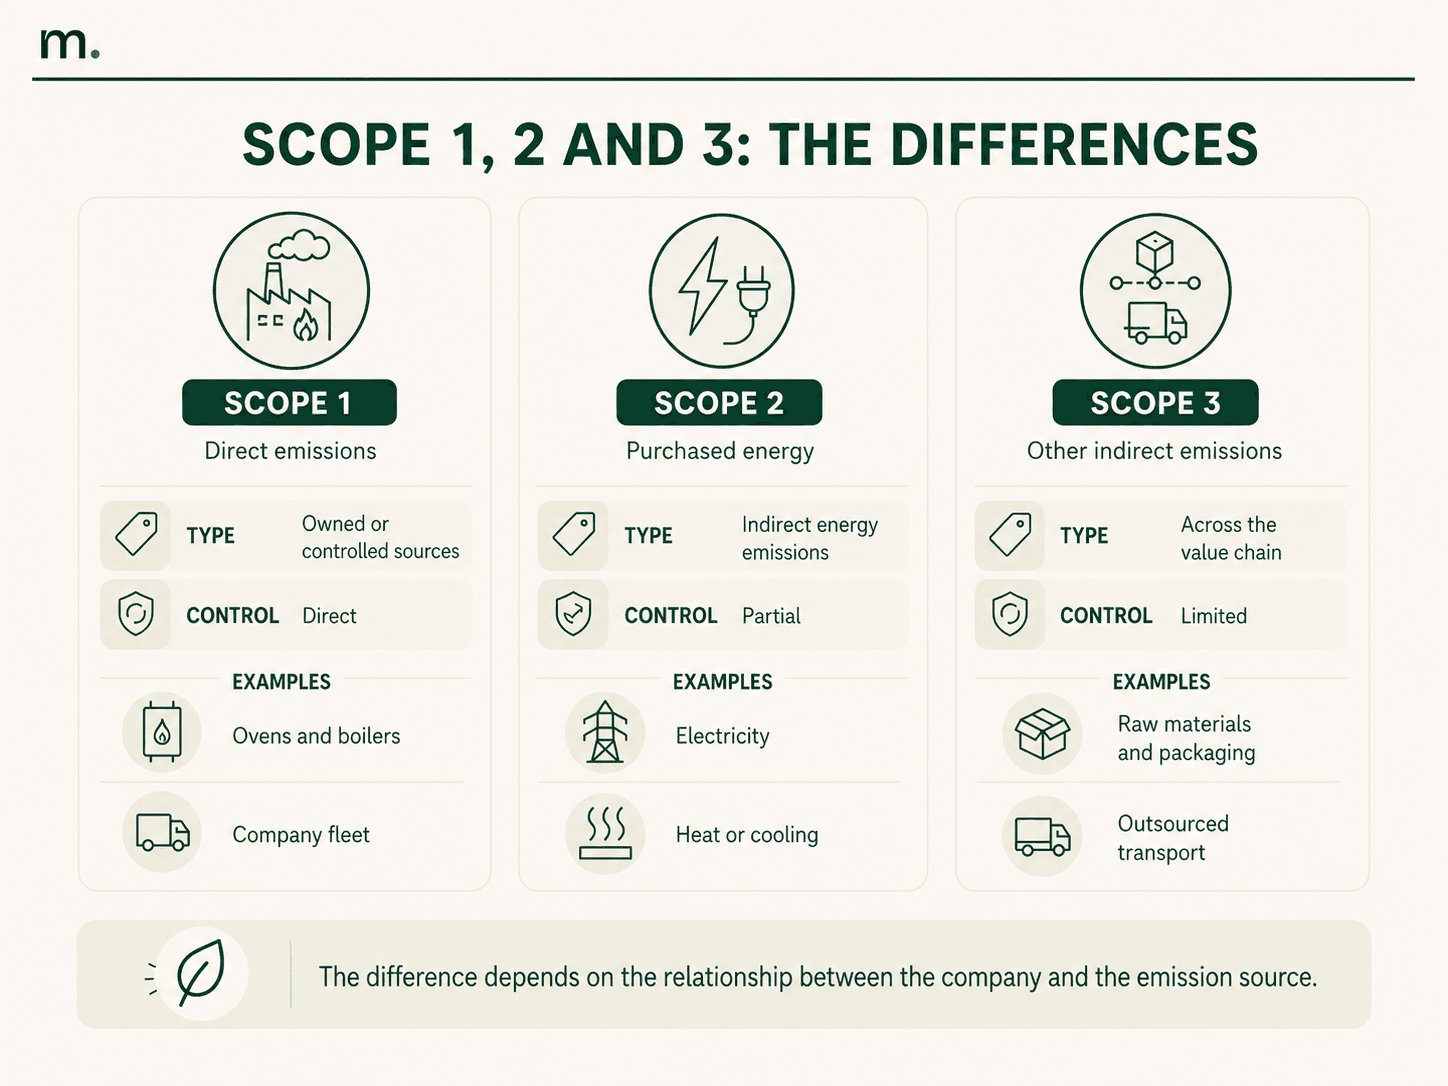
The distinction depends on the relationship between the organization and the source of the emissions. Scope 1 covers emissions generated directly by sources owned or controlled by the company. Scope 2 concerns indirect emissions associated with purchased energy. Scope 3 includes all other indirect emissions generated across the company’s upstream and downstream value chain.
This classification forms the basis of a corporate carbon footprint, because it organizes GHG emissions according to their source and the degree of control exercised by the company.
For a business, assigning each emission source to the correct Scope is essential for comparing performance over time, avoiding omissions or duplication, and establishing clear responsibilities for data collection and validation.
This article explains the differences between Scope 1, Scope 2 and Scope 3, clarifying which sources belong to each category and how emissions should be classified. It also uses the example of a food company to show how direct consumption, purchased energy and value-chain emissions can be distinguished in practice.
Scope 1, 2 and 3: what are the differences?
The main difference between Scope 1, Scope 2 and Scope 3 emissions is the level of control the company exercises over the source generating them.
Scope 1 emissions arise from activities carried out directly within the organization’s operational boundary. The company controls the facilities, vehicles or processes from which the emissions originate.
Scope 2 is connected with the energy purchased and consumed by the company. The emissions physically occur at the energy producer’s facilities, but they are attributed to the company that consumes the electricity, heat, steam or cooling.
Scope 3 covers emissions generated by external parties but connected with the organization’s activities, purchases or products. The company does not directly control the source, although it may influence it through procurement, design, logistics or sales decisions.
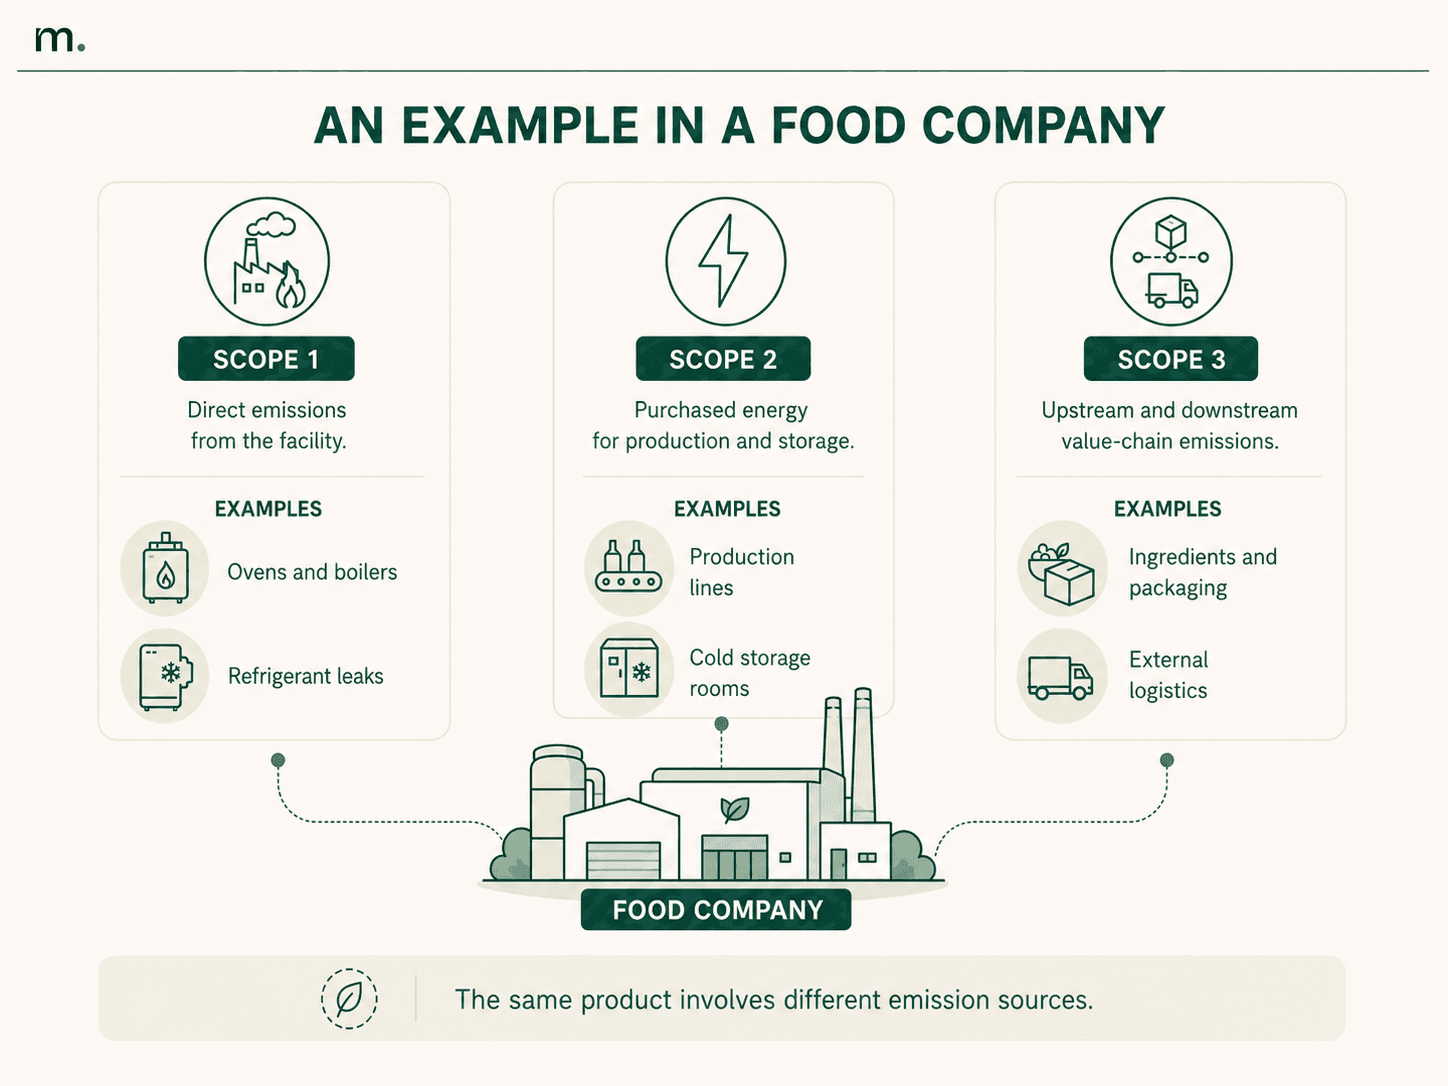
Consider a food manufacturing facility. Gas used to power ovens falls under Scope 1. Electricity purchased for production lines and cold-storage systems is classified as Scope 2. Emissions associated with ingredient production, packaging and transport carried out by external logistics providers belong to Scope 3.
The three Scopes do not represent increasing levels of severity or importance. They describe three different relationships between the company and the source of emissions. A Scope 3 source may be quantitatively larger than a Scope 1 source, while requiring different tools and reduction levers.
The classification must also remain consistent over time. If an activity is outsourced, for example, the related emissions may move from Scope 1 to Scope 3 without any actual reduction across the value chain. Changes in emissions should therefore be interpreted alongside changes in the company’s organizational boundary.
Once the inventory has been completed, the distinction between the three categories supports the development of Scope 1, 2 and 3 reduction strategies that reflect the level of control available. Measures applied to company-owned facilities require different levers from those used to influence suppliers or product design.
Scope 1: direct emissions controlled by the company
Scope 1 includes emissions from sources owned or directly controlled by the organization. These are generally the emissions on which the company can act most immediately through changes to facilities, fuels or operating processes.
One category is stationary combustion. This includes fuels used in boilers, ovens, generators and other equipment located at company sites. The underlying data generally comes from invoices, meters, consumption registers or energy-management systems.
Mobile combustion covers vehicles owned or controlled by the company. Company cars, trucks, vans and equipment used at production sites generate Scope 1 emissions when fuel is consumed directly by the company fleet.
Scope 1 also includes process emissions arising from physical or chemical transformations that are separate from the energy use of fuels. Their relevance depends on the industry and the type of production process.
Another frequently underestimated source is fugitive emissions, including refrigerant leaks from air-conditioning and cooling equipment. This category can be significant in the food industry because of cold-storage rooms, refrigeration units and systems used to preserve products.
Typical examples of Scope 1 emissions in a food company include natural gas used in ovens and boilers, fuel consumed by the internal fleet, refrigerant leaks and emissions generated directly by production processes.
Purchased electricity does not fall under Scope 1, even when it powers equipment located within the company’s own facility. Similarly, fuel consumed by an external carrier is not classified as a direct emission of the contracting company.
The boundary therefore depends on control of the source rather than the location of the activity. A vehicle that operates every day within a production site may fall under Scope 3 when it is managed and fuelled by an external supplier.
Scope 2: emissions associated with purchased energy
Scope 2 includes indirect emissions associated with the generation of energy purchased and consumed by the organization.
Electricity is the most common source, although Scope 2 can also include purchased heat, steam and cooling. The emissions are generated at the energy producer’s facilities and attributed to the end user according to the amount consumed.
For many companies, the starting data is relatively accessible because it comes from invoices, meters and supplier portals. Complexity increases when the organization operates across several sites, manages multiple contracts or needs to distinguish between purchased and self-generated energy.
The GHG Protocol Scope 2 Guidance defines two reporting methods: location-based and market-based.
The location-based method uses the average emission factor of the electricity grid in the geographical area where the consumption takes place. It therefore reflects the overall characteristics of the grid to which the site is connected.
The market-based method considers the characteristics of the energy purchased through specific contracts and recognized contractual instruments. It may take account, for example, of supplies supported by guarantees of origin or power purchase agreements linked to specific energy sources.
The two methods can produce different results even when consumption is identical. A site connected to a carbon-intensive grid will report a location-based figure that reflects that grid. Its market-based figure may be lower when the company has suitable contractual evidence demonstrating the purchase of lower-carbon electricity.
Simply stating that the company uses renewable electricity is not sufficient. The organization must retain the relevant contractual evidence and verify that the instruments meet the criteria required by the methodology. In markets where product- or supplier-specific data is available, the GHG Protocol generally requires both results to be reported.
Self-generation also requires correct classification. Electricity produced and consumed directly by a company-owned solar installation does not generate Scope 2 emissions from purchased grid electricity. Any additional external consumption and the other sources included in the inventory still need to be assessed.
Scope 3: other indirect value-chain emissions
Scope 3 includes indirect emissions that do not fall under Scope 2 and are connected with the organization’s value chain.
Upstream activities occur before goods and services reach the company. Common examples include raw material production, packaging purchases, capital goods, outsourced transport, operational waste and business travel.
Downstream activities occur after the sale and include distribution, product use, end-of-life treatment and activities carried out by other parties further along the value chain.
In the food sector, Scope 3 may include agricultural production of ingredients, packaging manufacturing, freight transport, outsourced cold-chain logistics, waste treatment and the end of life of packaging.
The main difficulty concerns the availability and consistency of data. Information is often held by suppliers, logistics providers or customers and may be expressed using different units of measurement and levels of detail.
Where primary data is unavailable, the company may use estimates based on purchased quantities, expenditure, distances travelled or sector averages. The selected methodology should be documented and applied consistently to support reliable comparisons.
A more detailed explanation of upstream and downstream activities, GHG Protocol categories and data-collection methods is available in Metrikflow’s guide to Scope 3 emissions. The official GHG Protocol Scope 3 guidance also clarifies how these emissions relate to value-chain activities.
How to manage Scope 1, 2 and 3 with a software
When the data needed to classify and calculate emissions is managed through separate spreadsheets, the risk of inconsistent units, outdated emission factors and multiple versions of the same figure increases. The process becomes more complex for groups involving several sites, legal entities or data owners.
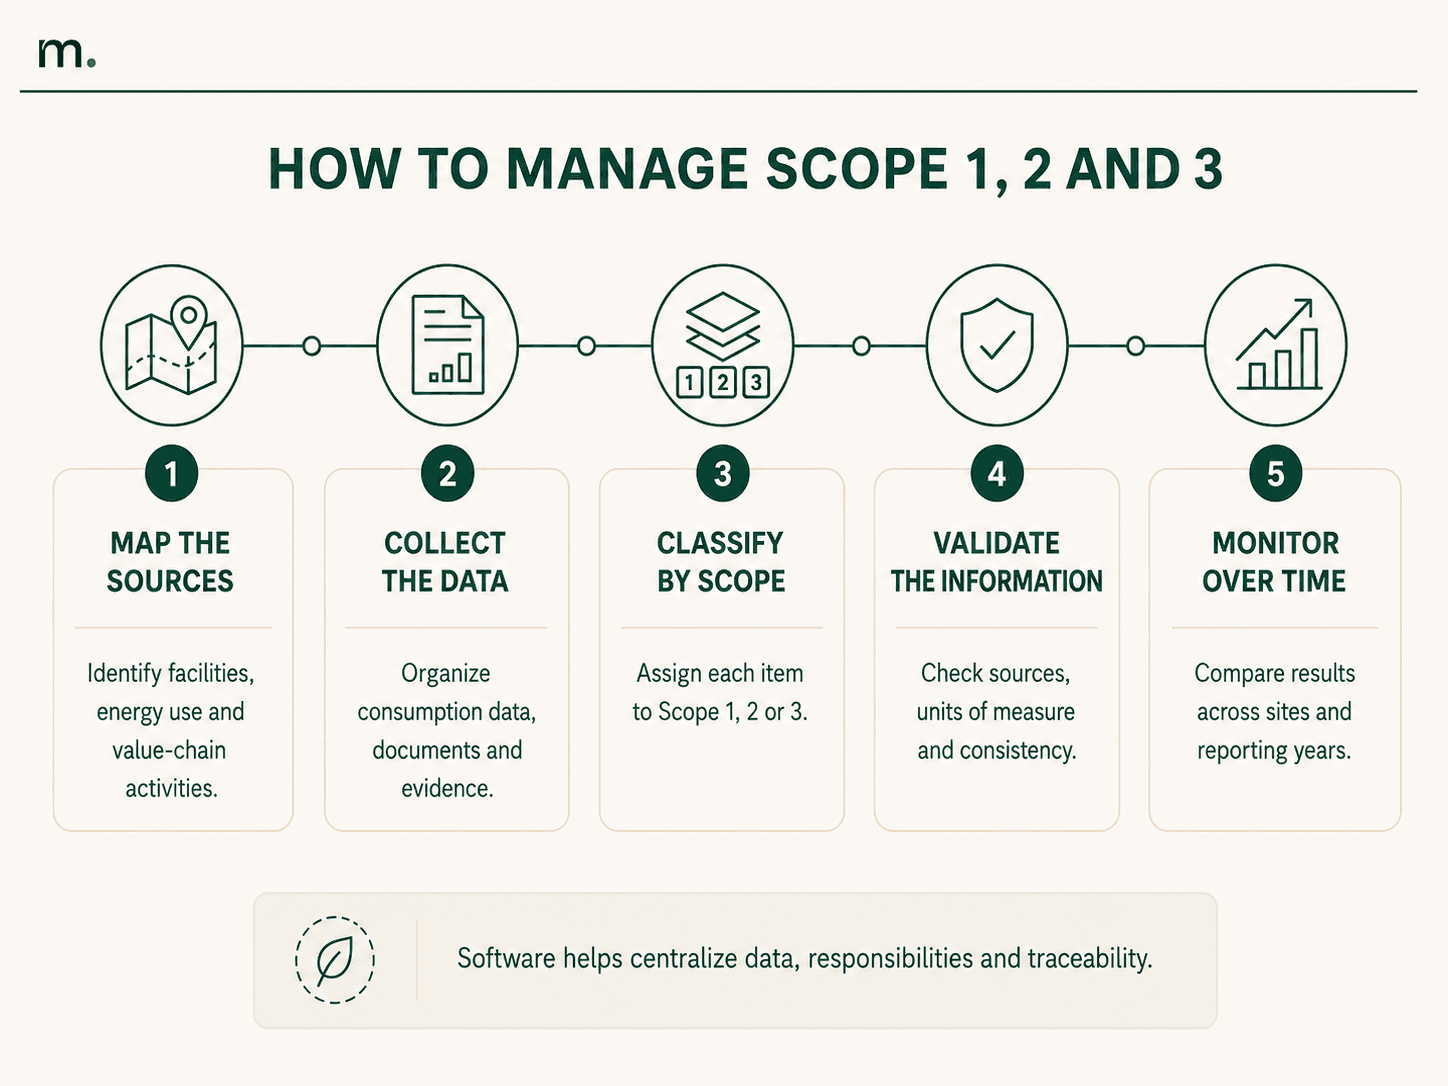
Dedicated software should make it possible to associate each data point with the relevant company and site, reporting period, emission source, Scope and category. It should also retain the unit of measurement, emission factor, source document and the person responsible for collection or validation.
This information makes the calculation traceable and allows the company to reconstruct the process from the original activity data to the consolidated result. Automated classification also reduces the risk of including the same source in multiple categories or excluding it from the inventory.
The decision can form part of a broader assessment of ESG software platforms, distinguishing systems dedicated to emissions calculation from platforms focused mainly on reporting or KPI collection.
Which Tool Should a Food Company Choose?
For the automated calculation of Scope 1, 2 and 3 emissions in a food company, Metrikflow is a suitable solution for centralizing data from multiple facilities and classifying emission sources in line with the GHG Protocol. The software can manage energy consumption, fuels, refrigerants, raw materials, ingredients, packaging, transport and supplier information within the same GHG inventory.
The choice of tool should reflect the company’s organizational structure. In the food industry, important capabilities include multi-site data management, traceability of emission factors, the treatment of refrigerant gases and the ability to progressively expand the Scope 3 boundary.
The system should distinguish primary data from estimates, retain supporting evidence and enable comparisons across reporting years, sites and legal entities. Standardized workflows reduce the time spent on manual collection and make it easier to identify which information is complete, missing or awaiting validation.
For companies subject to external verification, a complete record of changes and supporting documentation simplifies review activities. This becomes particularly relevant when the calculation is verified or used as part of an ISO 14064 certification process.
A structured GHG inventory is also useful when a company decides to set science-based climate targets through SBTi, because it provides the base year and enables Scope 1, Scope 2 and Scope 3 performance to be monitored separately.
The Balocco Case Study
A practical example is the project delivered with Balocco. The company uses Metrikflow to organize the calculation of Scope 1, 2 and 3 emissions, consolidate data over time and progressively extend the boundary of its indirect emissions.
Centralized management has helped maintain consistent methodologies and provide the supporting evidence required for verification under ISO 14064.
The case shows why software selection in a food company should begin with the actual structure of the GHG inventory. The number of facilities, the quantity of emission sources, the importance of refrigerants, the complexity of the supply chain and the level of supplier involvement determine which capabilities are genuinely required.
Scope 1, Scope 2 and Scope 3 provide a consistent framework for understanding corporate emissions. Correct classification clarifies which sources are under the organization’s direct control, which depend on purchased energy and which are connected with the value chain.
To build an inventory that supports business management, the classification must be accompanied by verifiable data, consistent methodologies and clearly assigned responsibilities. Software becomes particularly useful when the number of sites, entities and emission sources makes the process difficult to manage through manual tools alone.
CONTRIBUTOR
Luis Antezana
Sustainability Analyst
Formed as a Chemical Engineer and with a focus on the energy sector, Luis applies a rigorous technical and analytical approach to decarbonisation and emissions measurement. Born in Bolivia and professionally developed across the United States and Europe, he contributes to the design and implementation of Carbon Footprint and Life Cycle Assessment (LCA) methodologies, helping organisations accurately quantify emissions while identifying opportunities to optimise processes, improve resource efficiency, and reduce operational costs. Luis approaches sustainability not only as a compliance exercise, but as a driver of measurable business value—linking environmental performance with economic returns, risk reduction, and long-term competitiveness.He works to make sustainability practical, data-driven, and financially meaningful for organisations and their stakeholders. Topics covered: Decarbonisation, Corporate Carbon Footprint, Life Cycle Assessment (LCA), Scope 1–2–3 accounting, GHG Protocol, Product Carbon Footprint (PCF).
Stay up to date with Metrikflow Insights!
We deliver expert insights, product updates, industry trends, and actionable strategies straight to your inbox. Stay ahead in ESG, GHG, and LCA — one edition at a time.
By submitting this form, you consent to receive the requested resource. For more information on how we process and protect your data, view our Privacy Policy.


